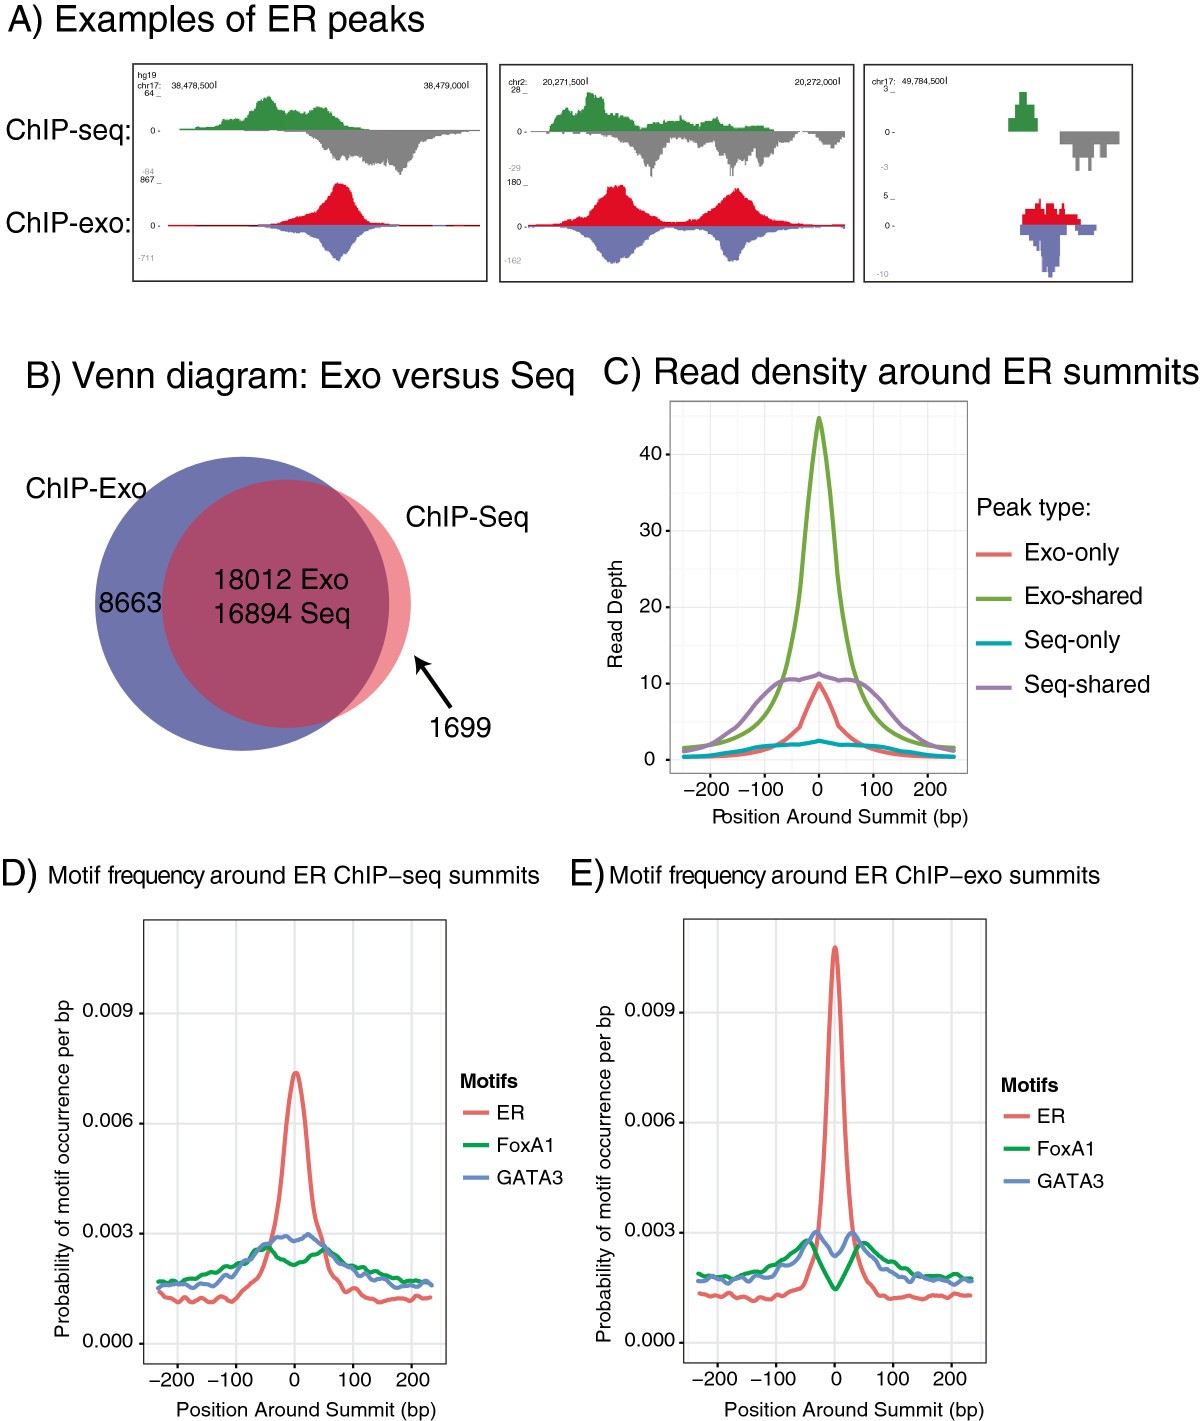
Figure 2

Comparison of ChIP-exo with ChIP-Seq. (A) Examples of ChIP-exo peaks and corresponding ChIP-seq peaks. (B) Venn diagram showing the overlap between consensus ChIP-exo peaks and consensus ChIP-seq peaks. The overlap region has separate numbers for -exo and -seq because some single peaks in -seq overlap two or more peaks in -exo. (C) Density plot of ER enrichment around summits, for exo-only, shared, and seq-only peaks. Shared peaks are shown separately for -exo and -seq peaks to show the difference in read depth and peak width. (D) Density plot of ER, FoxA1 and GATA3 motifs around ER summits found via ChIP-Seq. (E) Density plot of ER, FoxA1 and GATA3 motifs around ER summits found via ChIP-exo.
